Load F10.7from Multiple Sources
As shown in Loading F10.7, pysatSpaceWeather has several sources that
provide F10.7over different time periods. It can be useful to
combine these data sets into a single pysat.Instrument object.
This may be done using the
combine_f107() function.
import datetime as dt
import matplotlib as mpl
import matplotlib.pyplot as plt

import pysat
import pysatSpaceWeather as py_sw

f107_hist = pysat.Instrument(inst_module=py_sw.instruments.sw_f107,
                             tag='historic', update_files=True)
f107_prel = pysat.Instrument(inst_module=py_sw.instruments.sw_f107,
                             tag='prelim', update_files=True)
f107_fore = pysat.Instrument(inst_module=py_sw.instruments.sw_f107,
                             tag='45day', update_files=True)

# If needed, download the data
f107_hist.download(start=f107_hist.lasp_stime, stop=dt.datetime(2018, 4, 1))
f107_prel.download(start=f107_hist.files.files.index[-1],
                   stop=f107_prel.today())
f107_fore.download(start=f107_fore.today())

# Check the downloaded file range for the historic source
print(f107_hist.files.files.index.min(), f107_hist.files.files.index.max())
This should yield 1947-02-01 00:00:00 2018-04-30 00:00:00. Now, combine the
data in these pysat.Instruments using the
combine_f107() function
twice, after loading the available data
# Load all the data
f107_hist.load(date=f107_hist.lasp_stime,
               end_date=f107_hist.files.files.index.max() +
               dt.timedelta(days=1))
f107_prel.load(fname=f107_prel.files.files[0],
               stop_fname=f107_prel.files.files[-1])
f107_fore.load(date=f107_fore.today())

# Combine the historic sources for all available times
f107 = py_sw.instruments.methods.f107.combine_f107(f107_hist, f107_prel)

# Combine the 45 day measurements and forecast
f107 = py_sw.instruments.methods.f107.combine_f107(f107, f107_fore)

# Check the combined Instrument index
print(f107.index[0], f107.index[-1])
This print statement yields 1947-02-14 00:00:00 2022-10-07 00:00:00, where
the end date is roughly 45 days in the future to account for the forecasted data.
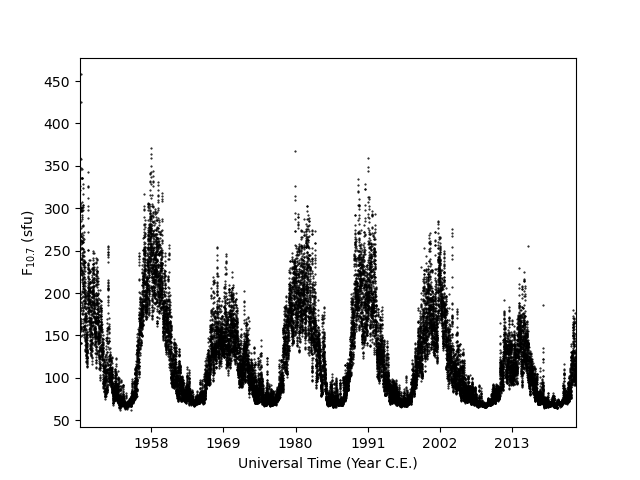
The combined pysat.Instrument varialbe, f107 can be used
to plot the F10.7over time.
fig = plt.figure()
ax = fig.add_subplot(111)

ax.plot(f107.index, f107['f107'], 'k.', ms=1)
ax.xaxis.set_major_formatter(mpl.dates.DateFormatter('%Y'))
ax.xaxis.set_major_locator(mpl.dates.YearLocator(11))
ax.set_xlim(f107.index[0], f107.index[-1])
ax.set_xlabel('Universal Time (Year C.E.)')
ax.set_ylabel(r'F$_{10.7}$ (sfu)')

# If not running in interactive mode
plt.show()